
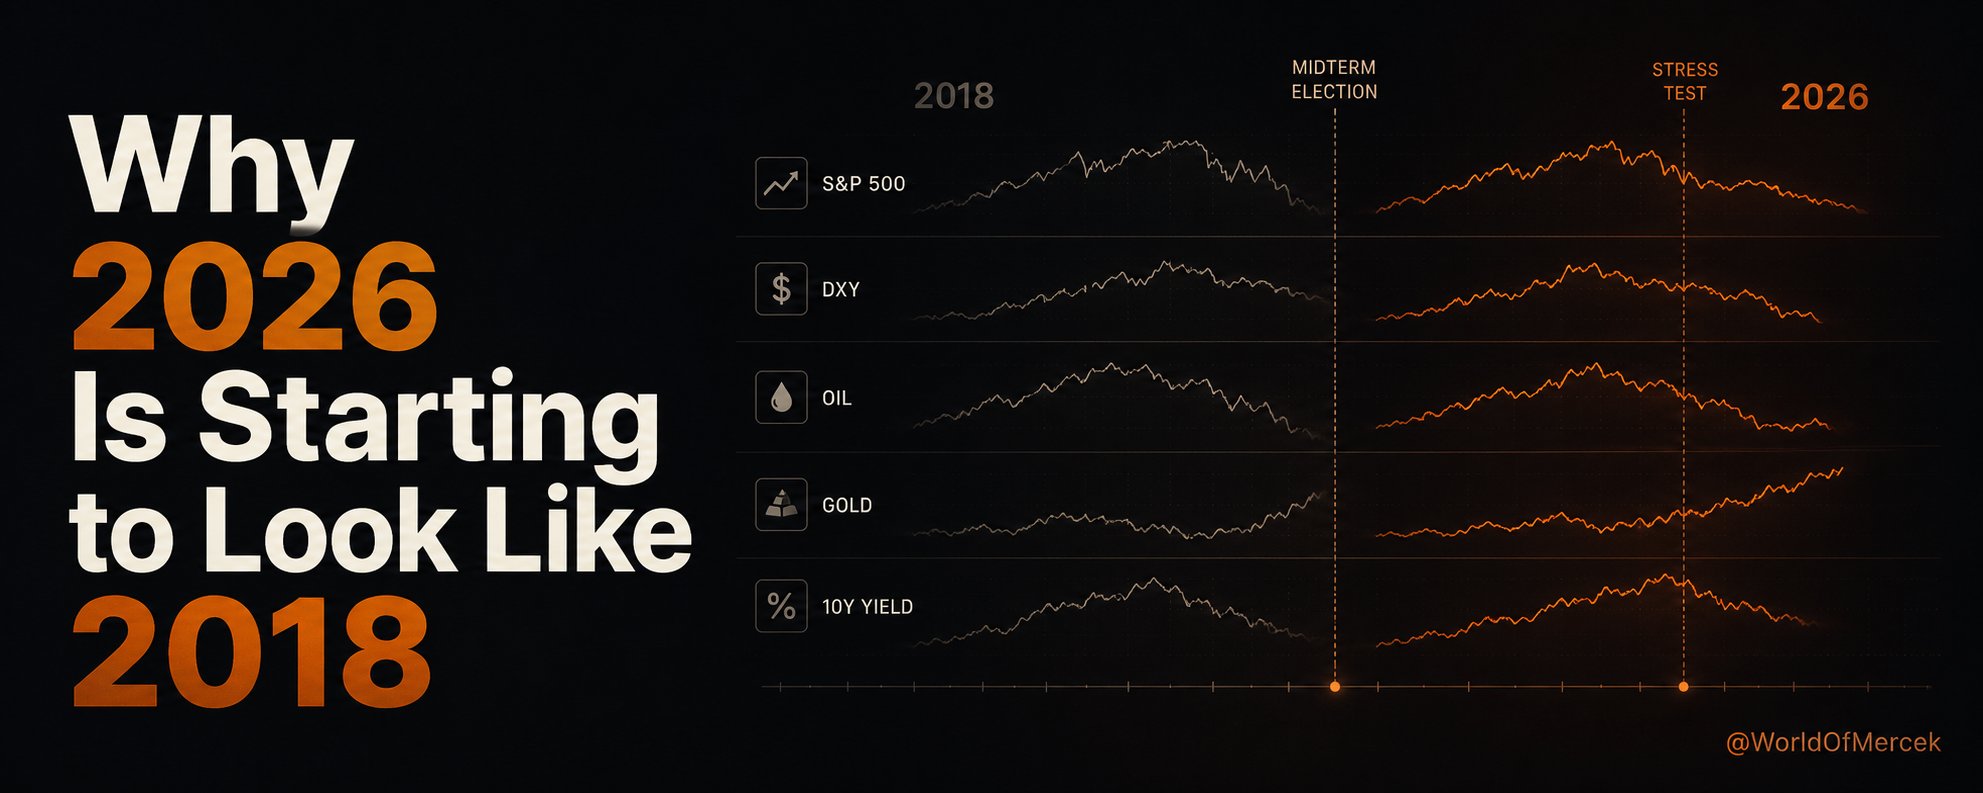
Historical comparisons are useful, but not because markets repeat the same path candle for candle. What matters is the sequence.
When I place the S&P 500, the dollar index, oil, gold and the U.S. 10-year Treasury yield on the same presidential timeline, the path through 2025 and 2026 begins to look surprisingly similar to the first two years of Trump’s previous term.
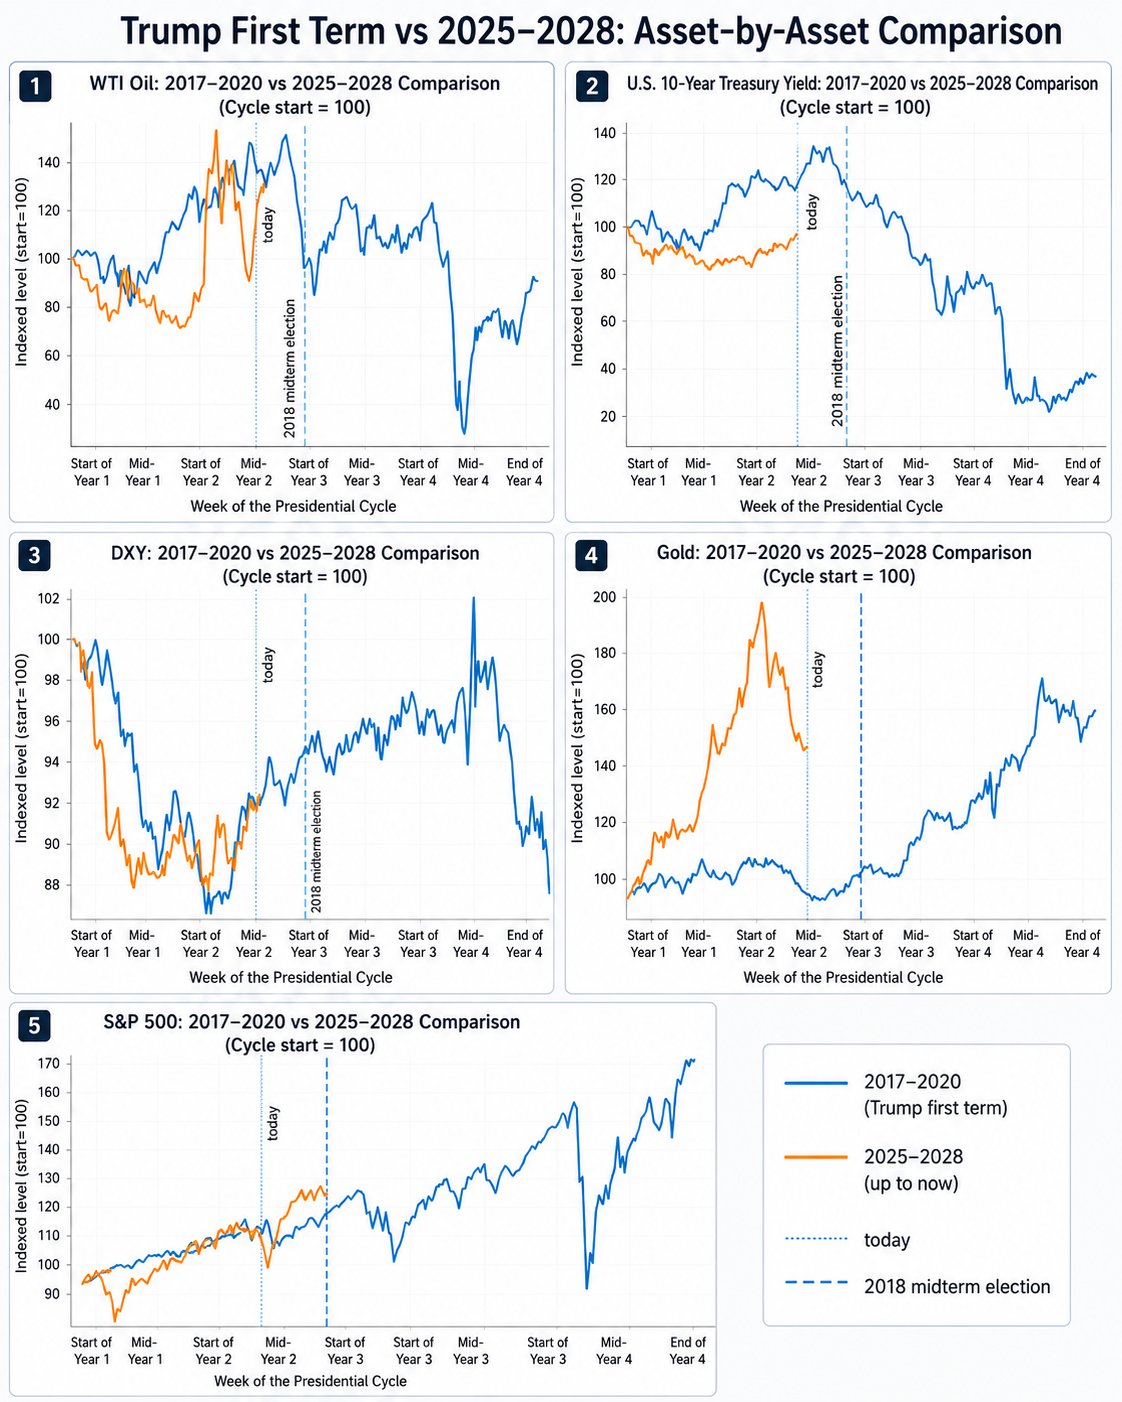
Not every line matches, and I would not expect it to.
But the order in which pressure is moving through markets looks familiar.
The dollar weakened first. Oil accelerated later. Long-term yields began turning higher. Equity markets continued to rise, but the cost of maintaining that growth became more visible.
A similar sequence appeared before the stress that eventually reached markets in late 2018.
That does not mean the same correction must arrive on the same date. Historical analogues are not forecasts.
But they can show us which part of the system is likely to be tested next.
The Same Playbook, but a More Expensive Environment
Trump is using many of the same tools that defined his first term.
Tariffs are being used to create negotiating pressure. Domestic production and strategic industries remain central to economic policy. Trade agreements are used to reduce tension after the initial pressure has been applied. At the same time, the administration wants to preserve the appearance of strong growth and investment.
Tariffs on metals, industrial equipment and other strategically important imports remain part of that broader attempt to bring production back to the United States.
The political playbook may look familiar, but the financial environment does not.
- Government debt is higher.
- Long-term borrowing costs are heavier.
- Inflation has not disappeared as a policy constraint.
- Gold also moved much earlier and much more aggressively than it did during Trump’s first term.
The same strategy is now being attempted in a system with less room for mistakes.
Why the Market Path Looks Familiar
The five assets in the chart do not follow the first Trump cycle perfectly, but several similarities stand out.
In both periods, the S&P 500 recovered after a sharp disruption early in the presidential term. By the middle of the second year, the two paths had moved into broadly similar territory.
The resemblance in the dollar is even clearer.
During both cycles, DXY weakened through much of the first year, formed a bottom around the beginning of the second year and then began recovering.
Oil followed its own version of the same rhythm: weakness during the first year, a much faster move higher in the second and rising volatility as the midterm elections approached.
Individually, none of these comparisons would be enough to build a market thesis.
Together, they suggest that markets may once again be searching for a balance between growth, trade pressure, inflation and liquidity.
The part I find most interesting is not where each asset finishes. It is the order in which they begin to move.
First, the dollar weakens.
Then oil rises.
Long-term yields begin responding.
Finally, the equity market is forced to prove that earnings and liquidity can still support current valuations while financing conditions become less friendly.
That was the real test in 2018.
I think it may become the real test again during the remainder of 2026.
Powell and Warsh Arrived at Similar Points in the Cycle
Another parallel appears at the Federal Reserve.
Jerome Powell became Fed Chair in February 2018. At the time, the Fed was already gradually normalizing interest rates and shrinking its balance sheet. The assumption was that a strong economy could absorb tighter monetary conditions without ending the expansion.
His arrival does not mean the Fed will automatically repeat the Powell era. But it creates another institutional transition at almost the same point in the political cycle.
Under Warsh, the Fed has already created task forces to examine its balance-sheet regime, inflation framework, communications, economic data and the effect of technologies such as AI on productivity and employment.
That makes the comparison more interesting than a simple change of personnel.
Trump wants fiscal, trade and industrial policy to support growth. Meanwhile, the Fed is questioning how monetary policy should operate, how large its balance sheet should be and how much liquidity the financial system actually requires.
In 2018, markets tolerated the combination of strong growth and monetary normalization for most of the year.
Then the pressure became too large, equities sold off sharply and the Fed’s tone eventually changed.
The question for 2026 is not whether Warsh will copy Powell.
It is whether markets can once again absorb a political push for growth while long-term rates and monetary conditions remain restrictive.
What the 2018 Midterms Changed
The 2018 midterm election did not weaken Trump in every part of government.
Democrats gained 41 seats and took control of the House, while Republicans retained control of the Senate. The result was a divided Congress.
That reduced Trump’s room to pass major legislation, but it did not remove his ability to act.
Trade policy, tariffs, foreign policy and executive authority became even more important because they did not always require the same level of congressional cooperation.
A similar outcome in 2026 would not necessarily stop the administration’s economic agenda.
Losing the House would make large tax, budget and legislative packages more difficult. But it could also push Trump toward the tools that remain directly available to the executive branch.
That could mean more reliance on tariffs, negotiations, executive orders and foreign-policy decisions.
For markets, a divided Congress may reduce the probability of major legislation while increasing uncertainty around the policies the president can pursue without Congress.
Why This Cycle Looks More Fragile
The largest differences between the two cycles appear in gold and bonds.
Gold has moved much earlier during the current cycle.
Even after its correction in 2026, it remains significantly above where it began in early 2025. That suggests investors are carrying a larger risk premium for government debt, inflation, geopolitical uncertainty and the long-term credibility of the monetary system.
The bond market also begins from a very different place.
During Trump’s first term, the system was operating with long-term rates closer to the 2-3% range. Today, the U.S. 10-year yield is above 4%, making debt refinancing, corporate borrowing and equity valuation much more sensitive to every move in yields.
The playbook may be similar. The cost of financing it is not.
That difference can change the entire outcome.
During the first term, the Fed had more room to respond once markets came under pressure. Today, easing aggressively is more difficult while inflation remains elevated and long-term yields continue to carry a meaningful risk premium.
If a 2018-style stress event develops, the policy response may arrive later or be more selective.
That is why I take the early move in gold seriously.
Gold may not be predicting an immediate crisis. But it is showing that the market assigns a much higher cost to policy mistakes than it did eight years ago.
What I Am Watching From Here
My base case is not that 2026 will perfectly repeat 2018.
It is that the remainder of the year may produce a similar stress test.
The current bull trend does not need to be abandoned simply because a historical comparison looks uncomfortable. But this may not be the best environment to enter the midterm period with excessive leverage.
The combination I would watch is straightforward.
| If this happens | What it means |
|---|---|
| DXY continues recovering while oil and the U.S. 10-year yield rise together | Financial conditions become more difficult. |
| At the same time, participation inside the S&P 500 begins narrowing | The market becomes more dependent on fewer companies to keep the index moving higher. |
| Gold also ends its correction and begins strengthening again | The message becomes harder to ignore. |
Individually, each signal can be explained away.
Together, they would suggest that the rotation is turning into something broader.
The immediate test comes from this week’s FOMC meeting, followed by the July 30 GDP and PCE releases. After that, the next scheduled Fed meeting is not until September 15-16, leaving markets with a long period in which trade policy, geopolitics and the midterm campaign may have more influence on sentiment.
As long as those indicators remain stable, leaving the broader uptrend entirely would be premature.
But the historical comparison still carries an important message.
Trump is rebuilding a familiar economic playbook.
This time, the system has more debt, higher financing costs and much less room to absorb a mistake.
This article reflects my personal market interpretation and is for informational purposes only. It is not financial advice. Historical comparisons are not forecasts, and markets can behave very differently even when the setup looks similar.