
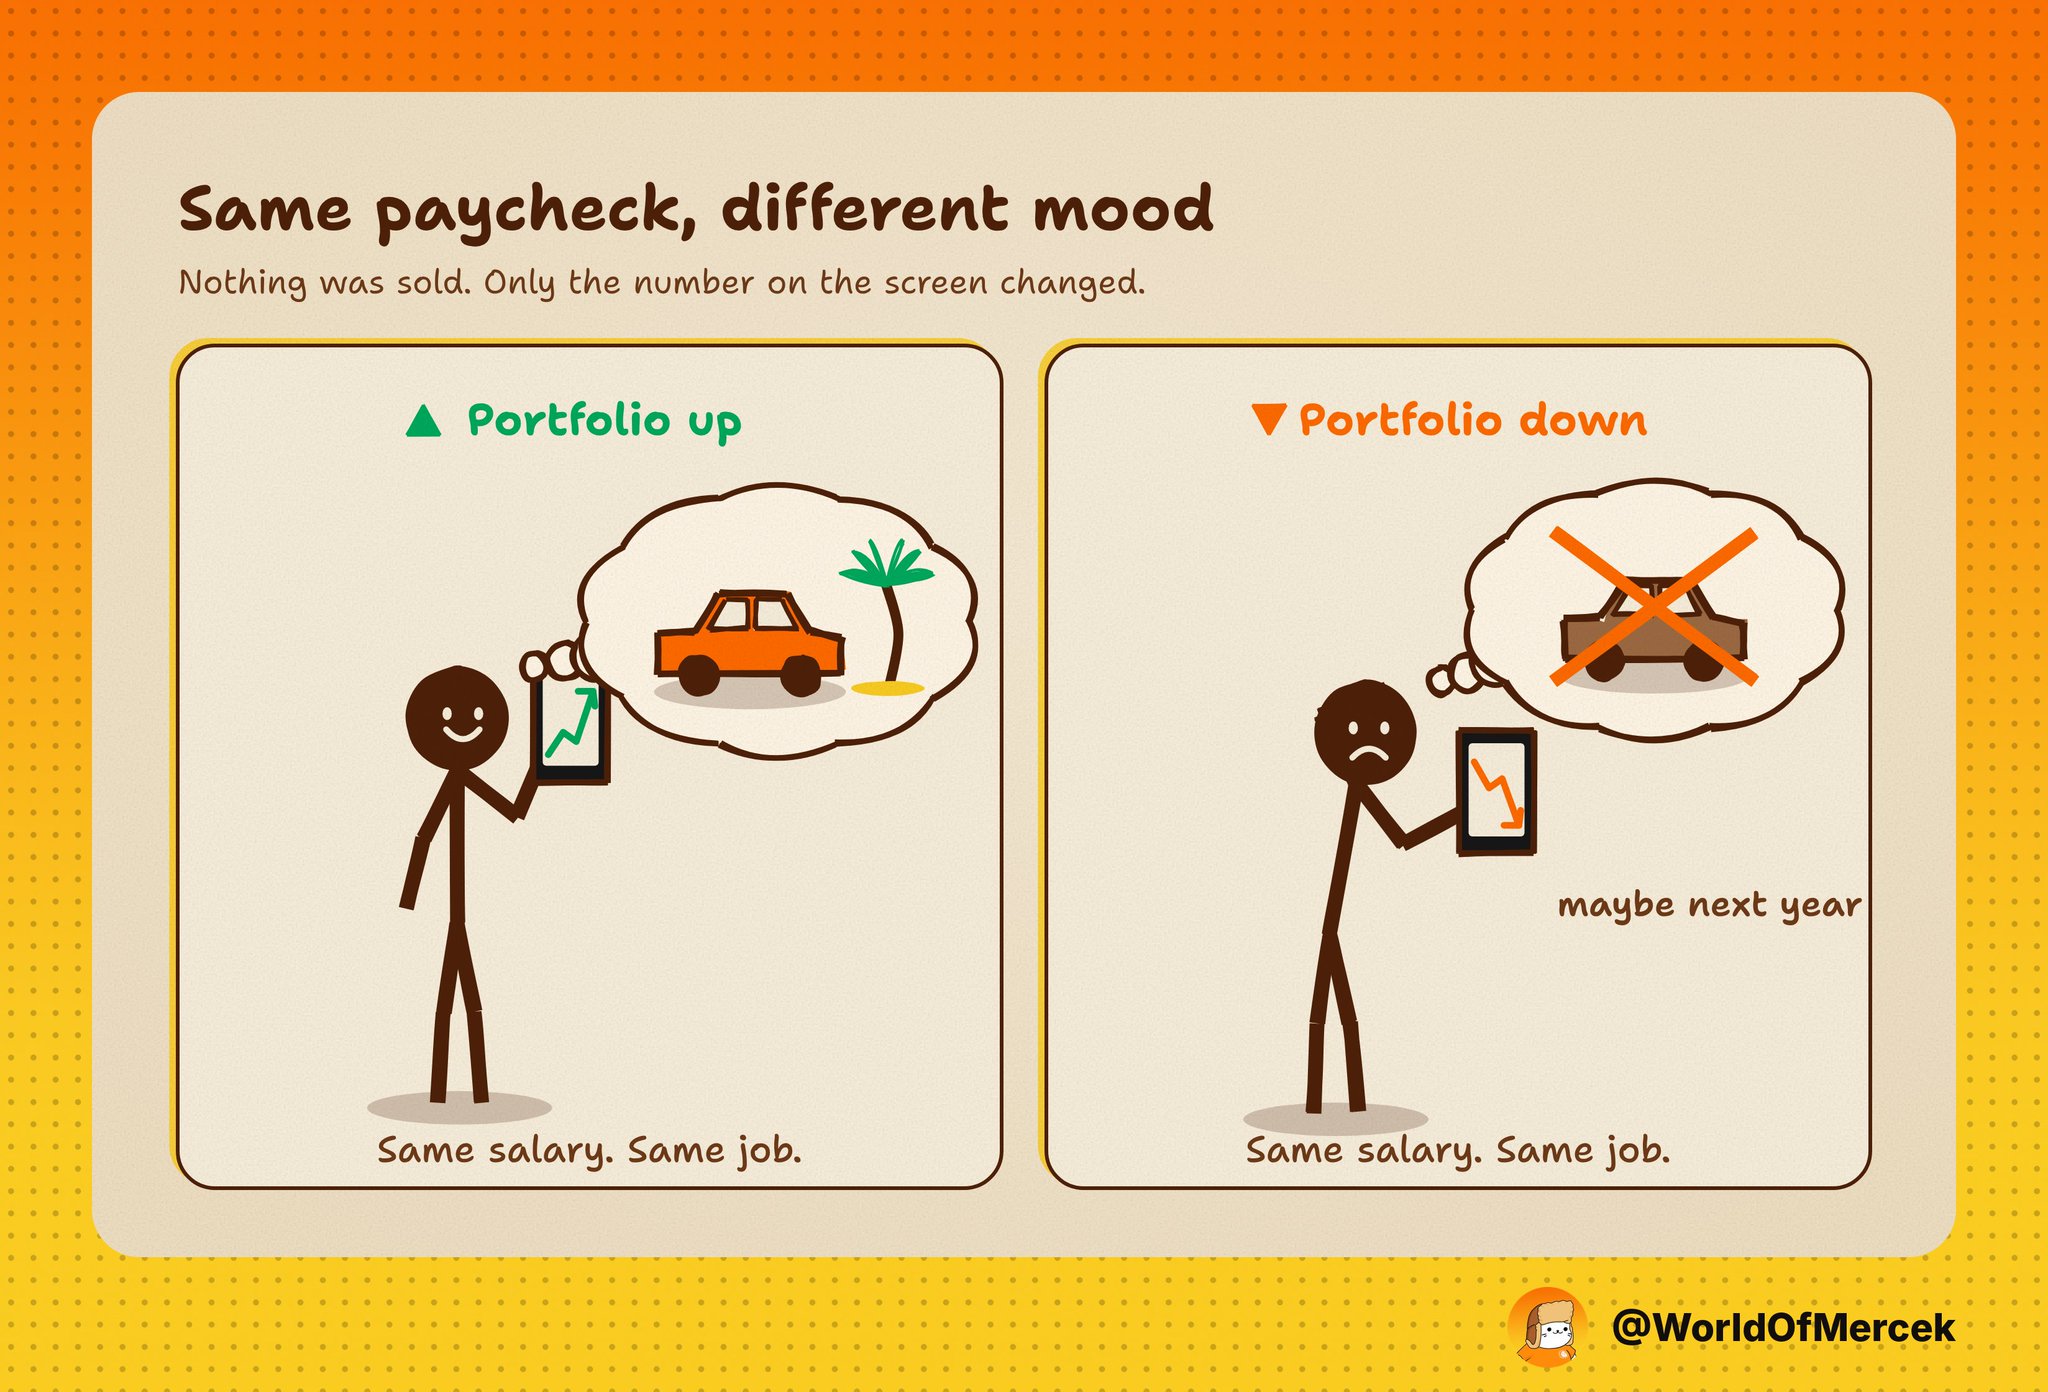
When your portfolio is doing well, a purchase you've been putting off for a while suddenly starts to feel reasonable. A new car, a proper holiday, maybe a bigger place. Your salary hasn't changed, but the number in your brokerage account has, and that number makes you feel a lot safer than you did a few months ago.
Then markets turn. You still have the same job and the same paycheck, and you haven't even sold anything, but the car can wait another year and the holiday turns into a long weekend. Nothing about your actual income changed, only the number on the screen, and that was enough to change what you do with your money.
It's a small, personal version of something that matters a lot for markets right now. When millions of people make that same small decision at the same time, a loss that started in one market shows up in places that never owned any of it. And the connections between markets have gotten much tighter than most people assume, which is why I don't buy the idea that an asset is safe just because it missed the last rally.
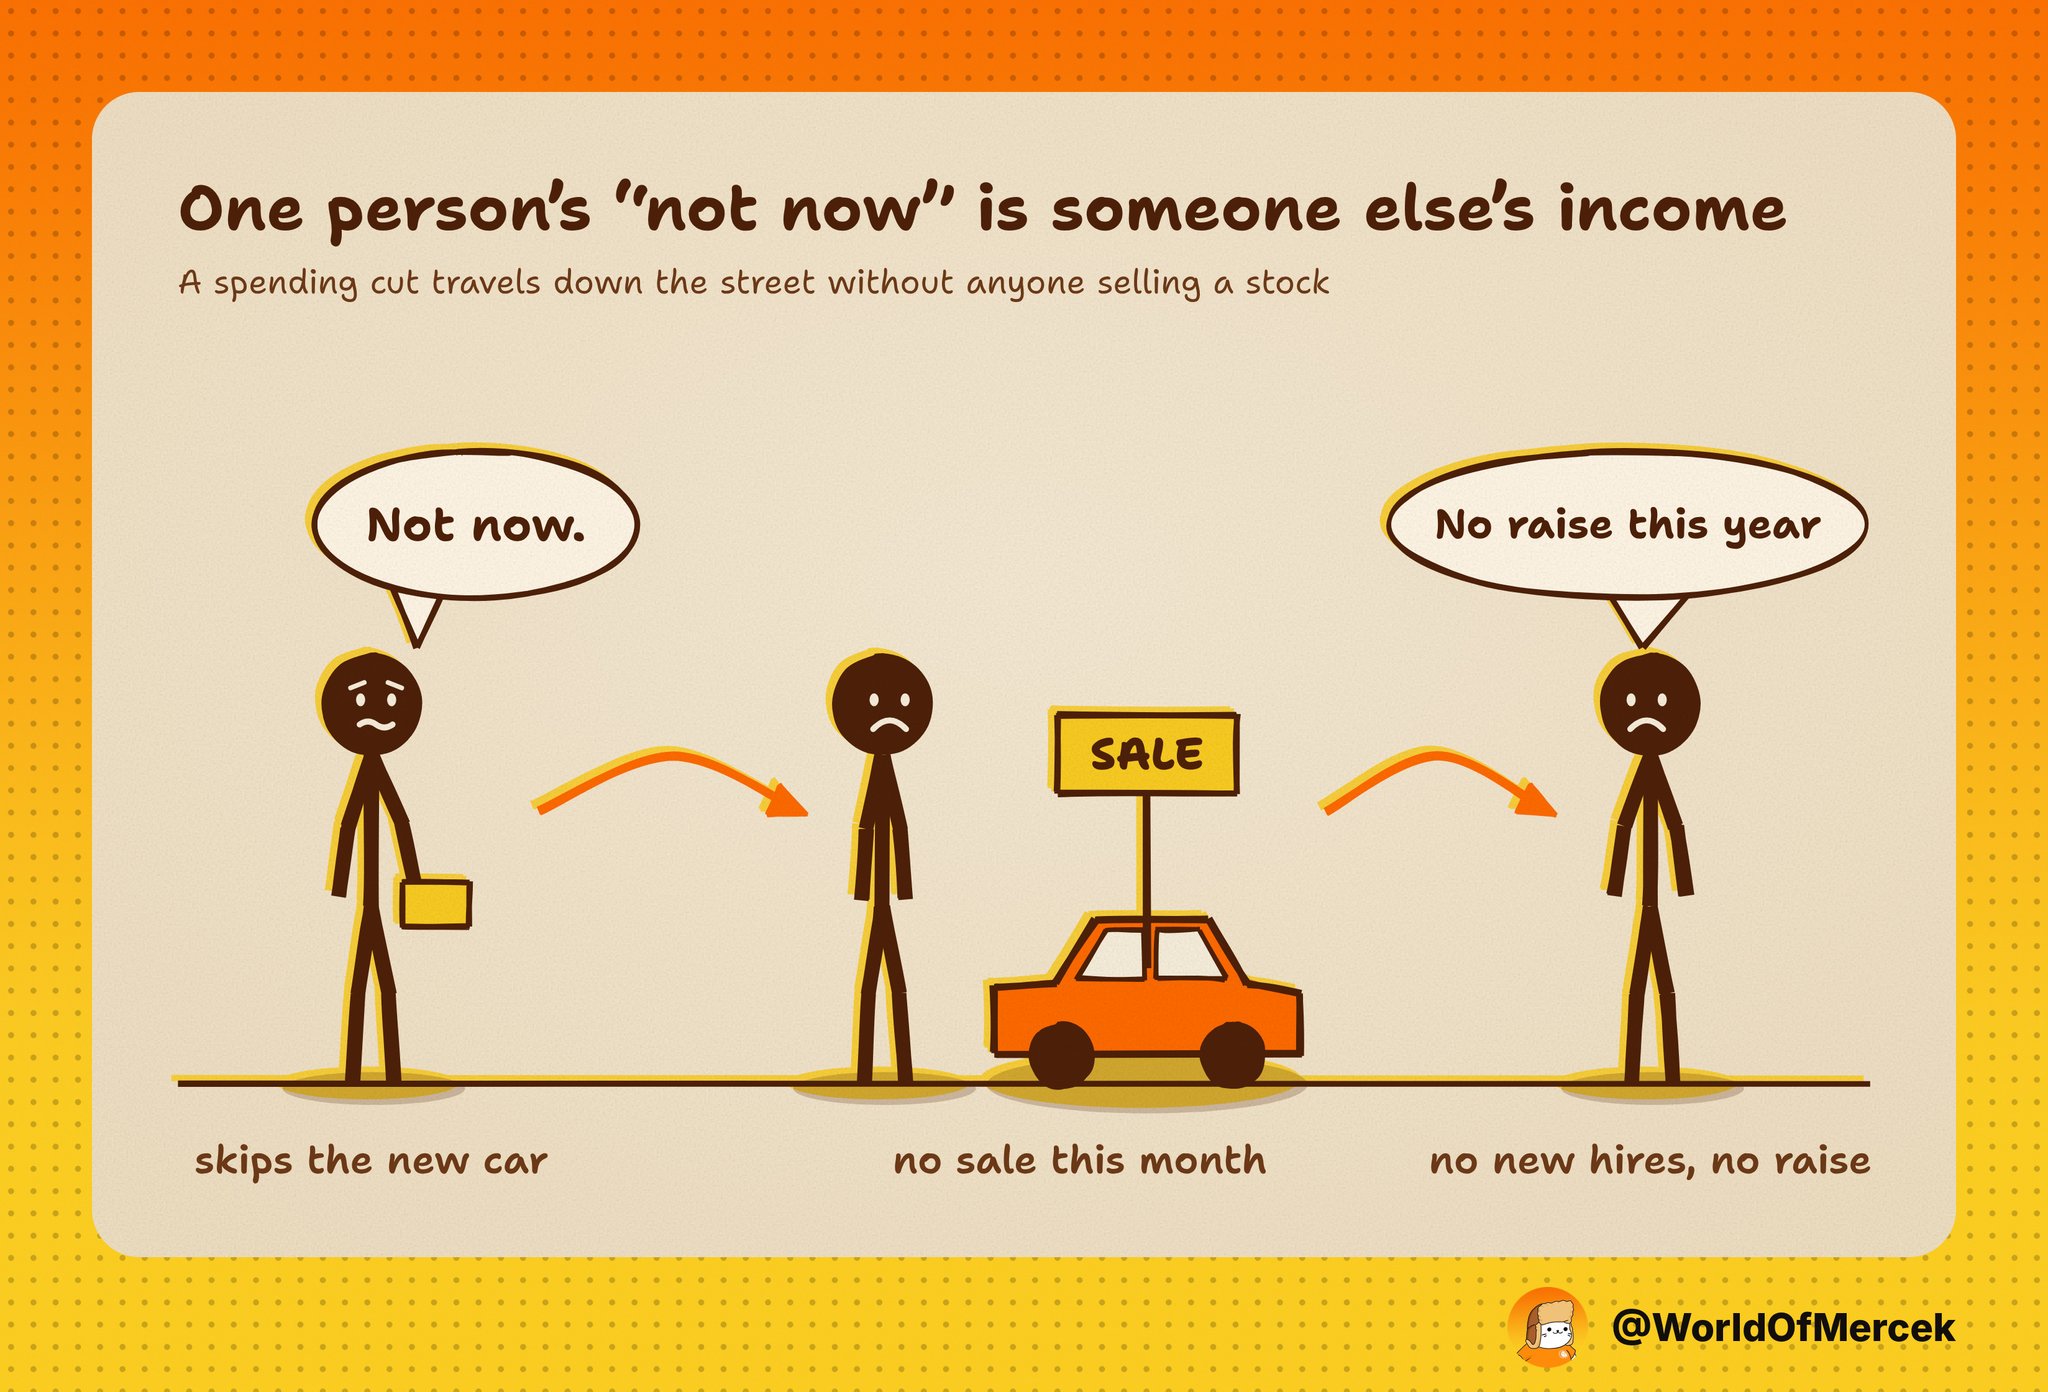
One person's "not now" is someone else's income
Economists call this the wealth effect. People spend more when the things they own are worth more, and less when those things lose value, even if nothing has actually been sold. One well-known study, by Gabriel Chodorow-Reich, Plamen Nenov and Alp Simsek, puts it at about 3 cents of extra spending a year for every extra dollar of stock wealth. That sounds tiny until you scale it. If a sell-off wiped $10 trillion off American households' portfolios, an estimate like that points to roughly $300 billion less spending over the following year, without anyone having to sell a single share.
That spending doesn't vanish into thin air either. The car you didn't buy is a sale the dealer didn't make, and when enough people skip the same purchase, the dealer stops hiring. Hotels feel it when holidays get shorter, and builders feel it when renovations get pushed to next year. That's how someone who has never owned a stock ends up feeling a stock market drop, usually through a job that wasn't posted or a raise that didn't come.
The effect is stronger now than it used to be, because spending and stock ownership sit with the same people. According to the Fed, the top 10% of households by wealth own about 88% of all the stocks and mutual fund shares held by American households. Moody's estimates that the top 10% of earners account for roughly half of all consumer spending, the highest share in its data going back to 1989. Other measures put that share lower and the method is debated, but the overlap is the point: a big part of the economy's spending now depends on how the stock market makes a fairly small group of people feel.
Why markets are tied so tightly to everyday life
Part of it is simply how much of our financial lives now runs through markets. For a lot of households, the biggest numbers they own are a retirement account, a brokerage account and a house, and all three are priced by markets every single day. Some economists call this hyperfinancialization, the point where finance stops being one sector of the economy and becomes the thing a lot of other decisions hang on.
The easiest way to see it is a home loan. If you borrow against your house while prices are rising, the bank sees solid collateral. If house prices drop hard, the same house supports a smaller loan, and depending on your contract, the bank can ask for more security or stop extending new credit. Nothing about you changed. The value of what you pledged did.
Companies, funds and banks run on the same logic, just at a much larger scale and with a lot more leverage. Margin debt, the money investors borrow from their brokers against their portfolios, hit a record of about $1.5 trillion in August, up around 140% since the end of 2022. As a share of the stock market it's roughly in line with its long-run average, so on its own this isn't a bubble signal. What it does tell you is how much of today's market is sitting on borrowed money, and borrowed money is what turns a price drop into a forced sale.
How a sell-off moves from one market to the next
When prices fall, everything that was pledged as collateral loses value with them, and lenders ask for more. In markets that's a margin call. If you don't have the cash, you have to sell something, and this is the part people tend to underestimate: you don't get to sell only the asset that's in trouble. You sell what you can sell quickly, which is usually whatever is most liquid, and often whatever is still in profit.
So a loss that starts in one market turns into selling pressure in another market that had nothing to do with it. That selling pushes prices down there too, which hits the collateral of everyone else holding those assets, and the next round of margin calls begins. When enough people are forced to cut their leverage at the same time, this deleveraging starts feeding on itself.

We've watched this play out more than once. In March 2020, even gold, the classic safe haven, fell 12% in ten days as funds sold whatever they could to meet margin calls, and Bitcoin lost more than 40% in a single day on March 12. In August 2024, a small Bank of Japan rate hike and a fast-rising yen forced traders to unwind positions they had funded by borrowing in yen. The Nikkei fell 12.4% in one session, and Bitcoin dropped 11% the same day. Then on October 10, 2025, a tariff headline set off more than $19 billion of liquidations in crypto within 24 hours, about twice the previous record.
Are markets really independent?
In normal times, different markets mostly follow their own stories. Tech stocks move on earnings, gold on real rates and fear, and crypto on flows and its own cycle, so the links between them stay loose. That's the world most diversification is built for, and most of the time it works.
Stress changes what investors care about. Once the priority shifts from making money to raising cash, paying down debt and cutting risk, the differences between assets matter a lot less than who owns them and how much they borrowed to do it. That's why things that barely move together in calm markets can fall together in a big sell-off, especially where leverage is concentrated. Traders have an old line for it: in a crisis, all correlations go to one.
None of this means every correction turns into a chain reaction. How much leverage is in the system, how tight credit is and how big the selling gets all change the outcome, and sometimes money leaving one market rotates into another and creates new opportunities. But after a big loss, it's hard to assume the same capital keeps taking the same amount of risk.
What this means for crypto
This is where it gets personal for anyone in crypto. Bitcoin largely missed this year's stock rally. It's about 35% below its October 2025 record and lower than where it started 2026, while AI stocks did most of the heavy lifting for the S&P 500. I keep seeing the argument that this makes crypto the safer place to be if stocks finally crack, because there's less froth left to come out of it.
I don't find that convincing. In a sell-off, the question isn't whether an asset went up with everything else, it's who holds it and how they paid for it. A lot of Bitcoin now sits with the same kind of investors who hold stocks, through ETFs, funds and corporate treasuries, and some of that is financed with borrowed money. Crypto also trades around the clock, so when someone needs cash on a Saturday night, it's one of the few things they can actually sell. That's a big part of why Bitcoin tends to get hit early in these episodes rather than late.
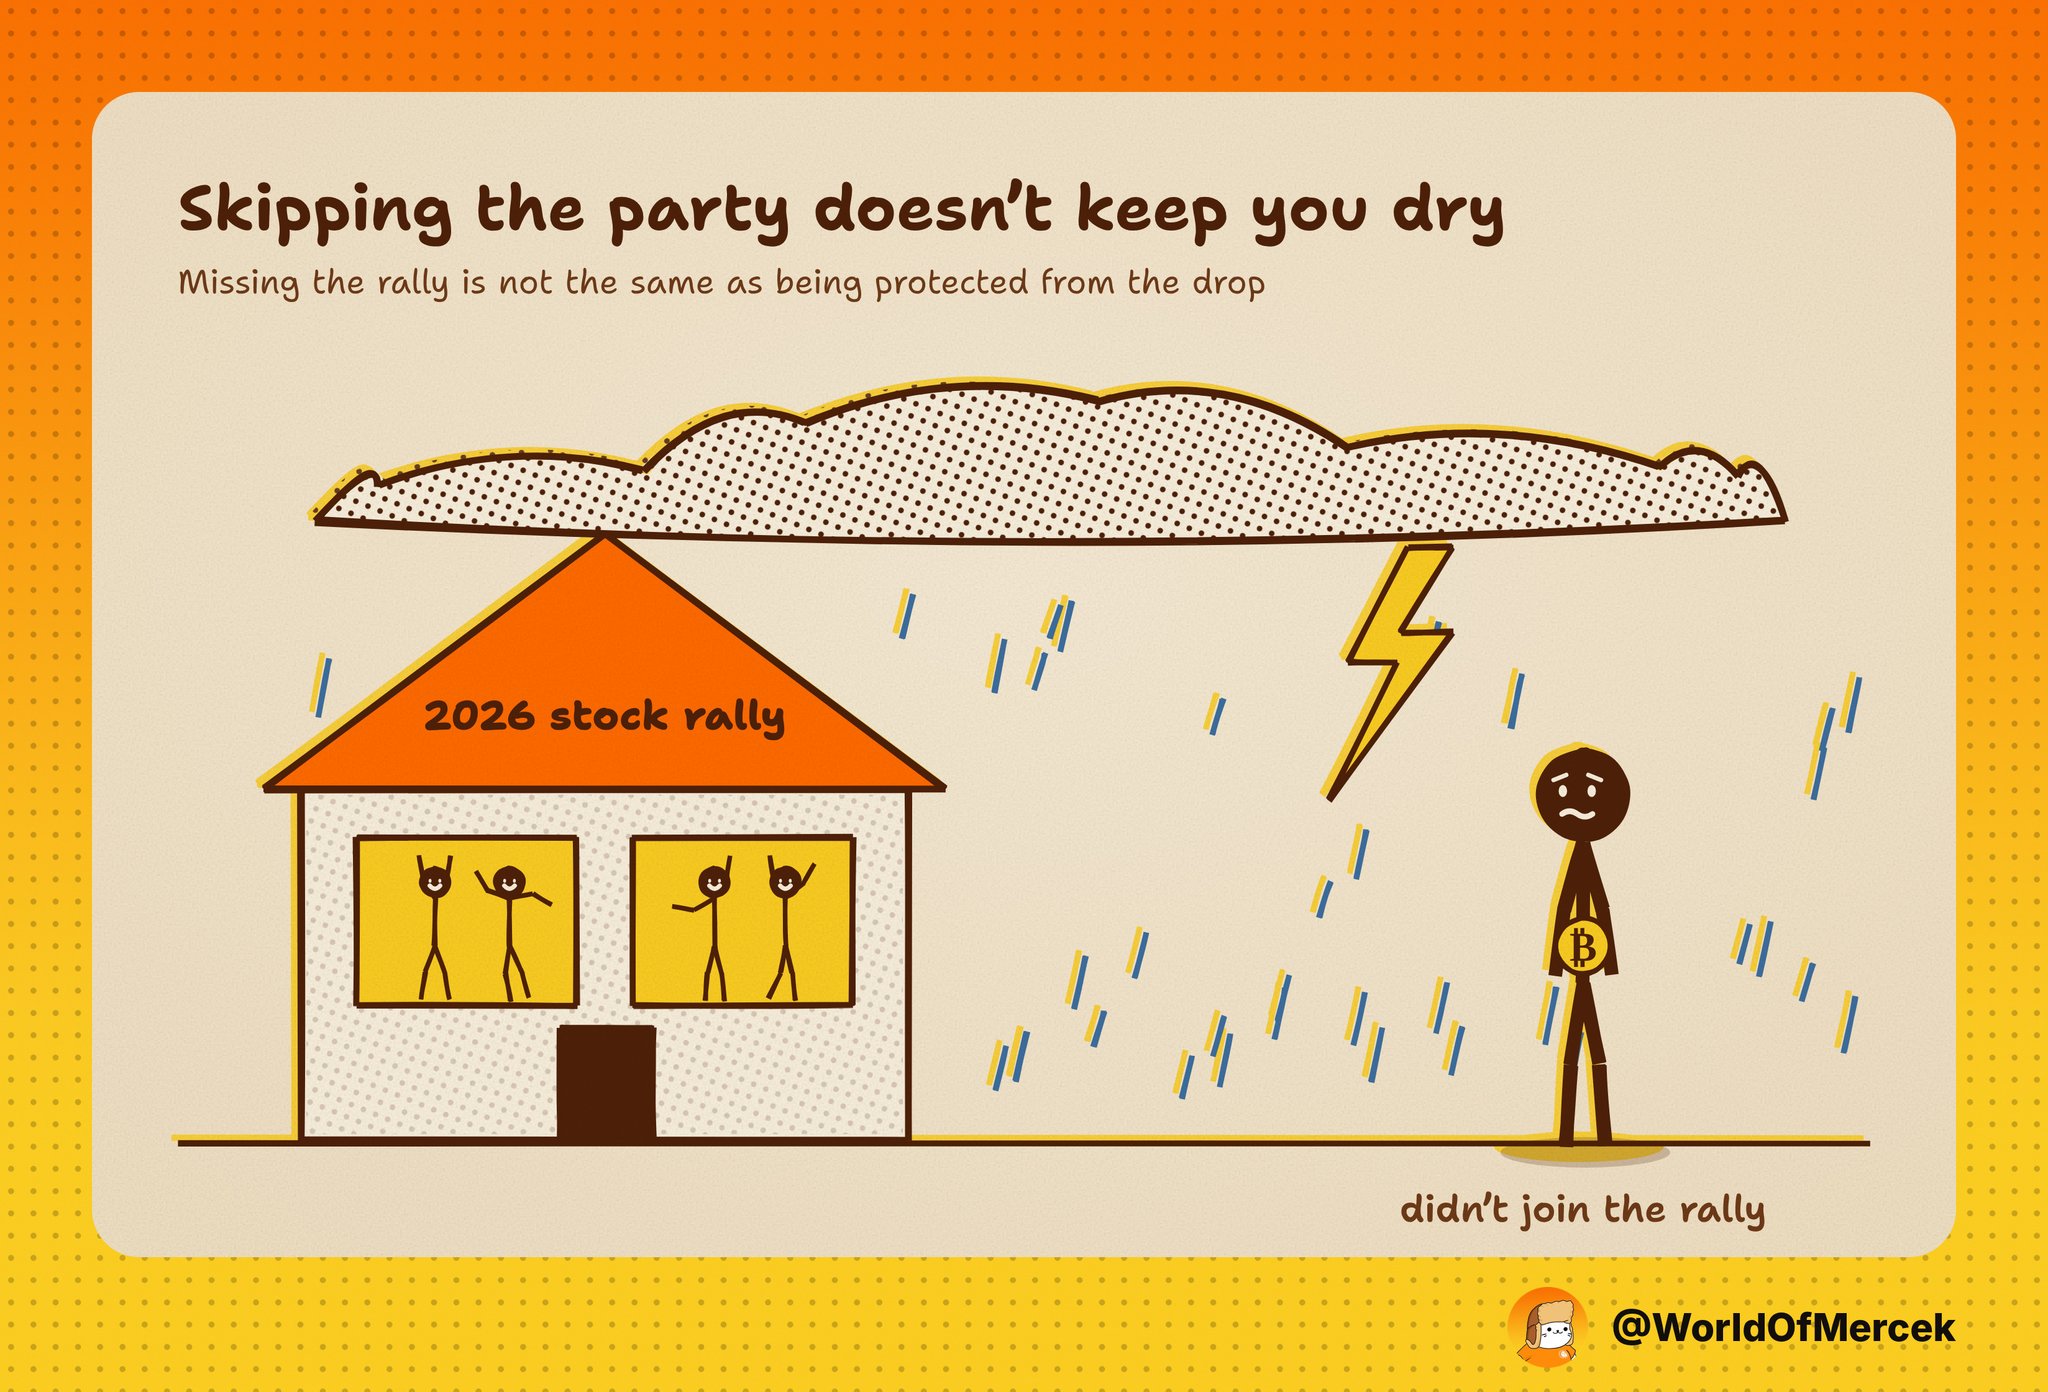
We got a small reminder of this last week. On Thursday, October 22, the Nasdaq fell 2.6% and Bitcoin fell the same day, even though it never joined the rally on the way up.
It also ties back to what I wrote last week about credit starting to crack at the bottom. If that stress spreads beyond the weakest borrowers, the selling that follows won't check which assets were expensive before it goes looking for cash.
How I'm reading it
Missing a rally isn't the same thing as being protected from the next drop.
When I think about how a sell-off could travel, I care less about which asset went up the most and more about the people holding it: how much they borrowed, what they pledged as collateral, and what they would have to sell first if the margin call came.
Right now, the things I'm watching are the ones that connect markets rather than the ones that describe them. Margin debt is at a record, the weakest corporate borrowers are paying more than they did at the worst of the April 2025 tariff shock, and the 10-year Treasury yield is sitting around 5%. None of that guarantees a chain reaction. But it's the plumbing a loss would travel through, and when a big one hits, it rarely stays in the market where it started.
Sources
Federal Reserve Distributional Financial Accounts (Q2 2026); Moody's Analytics via Bloomberg; Chodorow-Reich, Nenov and Simsek, "Stock Market Wealth and the Real Economy" (NBER); FINRA margin statistics via First Trust; CoinDesk; CoinGlass data via MoneySense.
This article is for informational purposes only and isn't financial or investment advice. It reflects my own reading of public data and reports as of October 2026, and markets can change quickly. Always do your own research before making any investment decision.